Quantitative EEG Brainmapping

EEG, or electroencephalogram, is the recording of electrical activity of the brain by means of electrodes placed on the surface of the head. In medical settings, EEGs are mostly used to look for seizure activity in the brain. However, the EEG contains a lot information that can be used to determine how brain activity might be connected to a persons symptoms of depression, anxiety, insomnia, and problems with attention, memory, and learning.
Brain mapping begins with 19 channel EEG recordings taken under eyes open and eyes closed conditions. EEG data may also be collected during tasks such as reading and listening. EEG analysis is the interpretation of the brain wave recordings first through a visual examination of the type of waves and abnomalities of size, shape, and patterns. The visual analysis may reveal abnormalities such as seizure activity which might warrant a referral to a neurologist. Computer software can also be used to examine the brain electrical activity.
Types of brainwaves (Frequency or Hz = cycles per second)
Delta 1-3 Hz = Slow wave associated with sleep. Should not be dominant in adults. Excess delta may be associated with damage to the brain in head injuries and learning disabilities.
Theta 4-8 Hz = Daydream-like state of mind. Excess causes attention problems. Excess daydream waves (theta) and deficient thinking waves (beta) is seen in one type of attention deficit disorder.
Alpha 8 –12 Hz = Relaxed idling brain waiting to respond. Excess alpha may be associated with attention problems, depression, and memory disorders. Too little alpha may be seen in those with alcoholism, insomnia, and anxiety.
Beta 12 –20 Hz = Small fast waves occur with mental activity and concentration. Deficient beta may be present in attention problems, learning disabilities, and brain injuries. Excess beta (brain over arousal) is associated with anxiety, alcoholism, insomnia, PTSD, and attention problems.
High Beta 20 –30 Hz = Fast waves associated with worry, anxiety, over thinking.
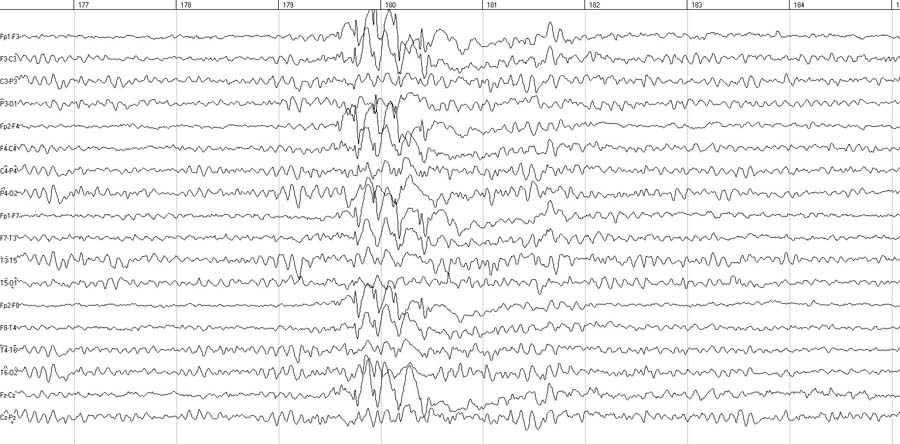
*This is a sample EEG showing a possible seizure disorder (a spike followed by a large wave). Each horizontal line is an electrode on the scalp. Each vertical column is one second of recording time. The frequency of the EEG activity is the number of pulses in one second.
QEEG, or Quantitive EEG, is the mathematical and statistical analysis of the brain's electrical activity. Carefully edited EEG data is processed through special EEG databases to compare the individual's brain function to people of similar age without illness or pathology. This comparison helps to identify areas of the brain that are producing abnormalities in terms of amounts and types of electrical activity, coherence (essentially connectivity between sites), and phase (speed of information between sites).
Brain mapping typically reveals patterns of excesses or deficiencies in brain wave frequencies that are characteristic for certain disorders. Problems with connectivity between sites in the brain may be the key issue in epilepsy and learning disabilities. Medications typically do not change these underlying problems, leaving you to suffer with reoccuring or chronic symptoms.
The QEEG can assist in differentiating between students with ADHD, learning disability, depression, head injuries, and seizure disorders. Learning disabled population have slower patterns of brain activity with excess delta frequencies (1-3.5 Hz) over the central and parietal lobes. Low blood perfusion in the frontal areas in ADD/ADHD shows as an idling frequency of alpha (8-13 Hz) and/or theta (4-7 Hz). The qEEG can differentiate between forms of ADD/ADHD, each of which respond to different therapies.
Brain maps can help determine the type of disorder, where in the brain the problem is, and how to treat it. The brain map is very helpful in planning how brain biofeedback can be used to treat the problem.
![]()