Procedures
Many people do not require brain maps. However, in some cases a brain map can be very helpful to determine the location and type of brain dysfunction.
This page shows some of the procedures involved in obtaining a measurement of brain activity for a brain map. At the bottom of the page there is a brief description of two types of brain biofeedback.
Electroencephalography
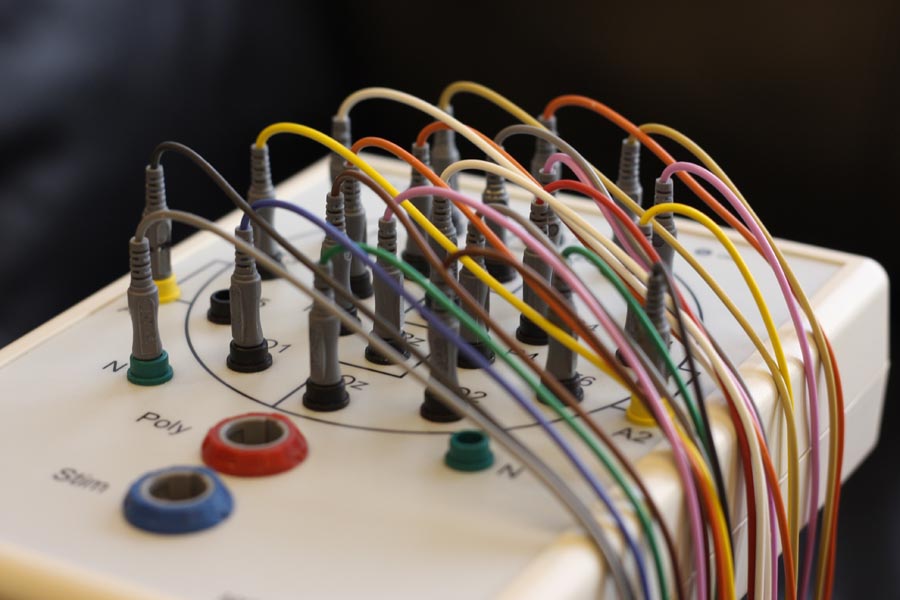
Image: Electroencephalograph is used to measure electrical activity of the brain.
The EEG machine is connected to the head either with individual wires or with an electrode cap.
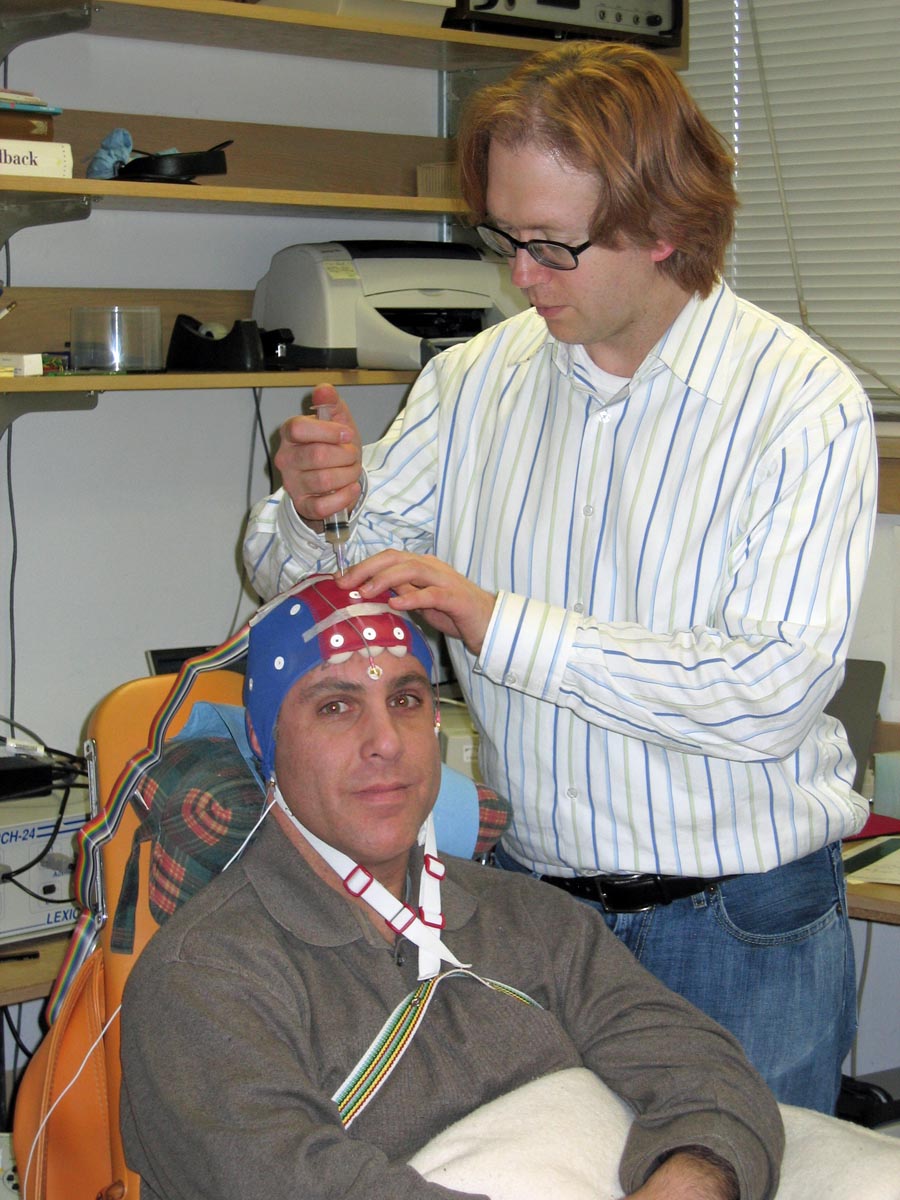
Image: Connecting electrode cap
The final step of putting on the electrode cap is injecting gel into the electrode cups with a blunt syringe. This makes a connection between the scalp and the electrode. Electrodes are also placed on the ear lobes and on the forehead and cheek. The strap around the chest is to help keep the electrode cap in place.
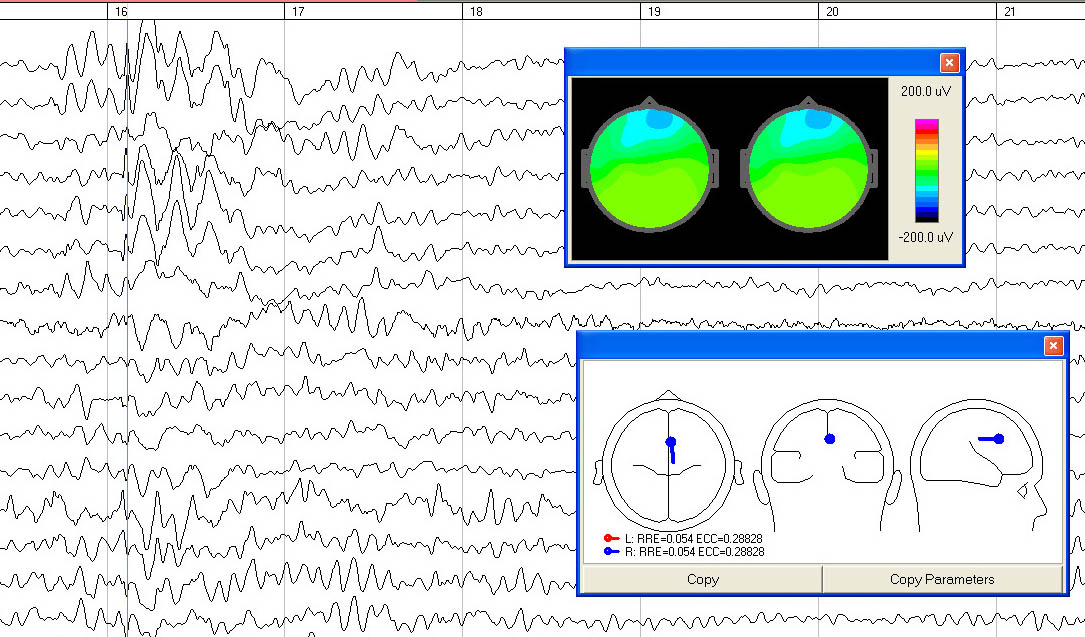
Image: Analysis of event in raw EEG tracing.
The EEG recording for producing a brain map is different from a traditional medical EEG. However, the EEG can still be examined for abnormal activity that might warrant a referral to a neurologist. This would include spikes and sharp waves in the EEG that might indicate the presence of a seizure disorder.
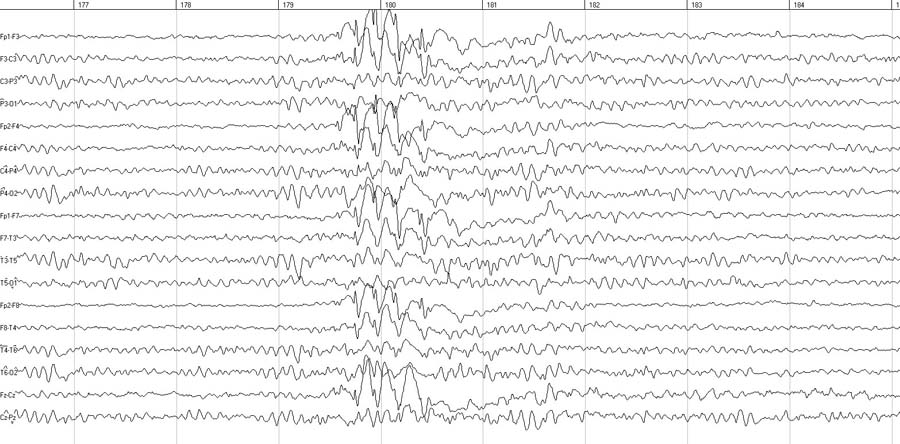
Image: Sample of spike and wave event in EEG indicating possible seizure disorder.
Quantitative EEG
This is the analysis of the EEG to produce the "brain maps".
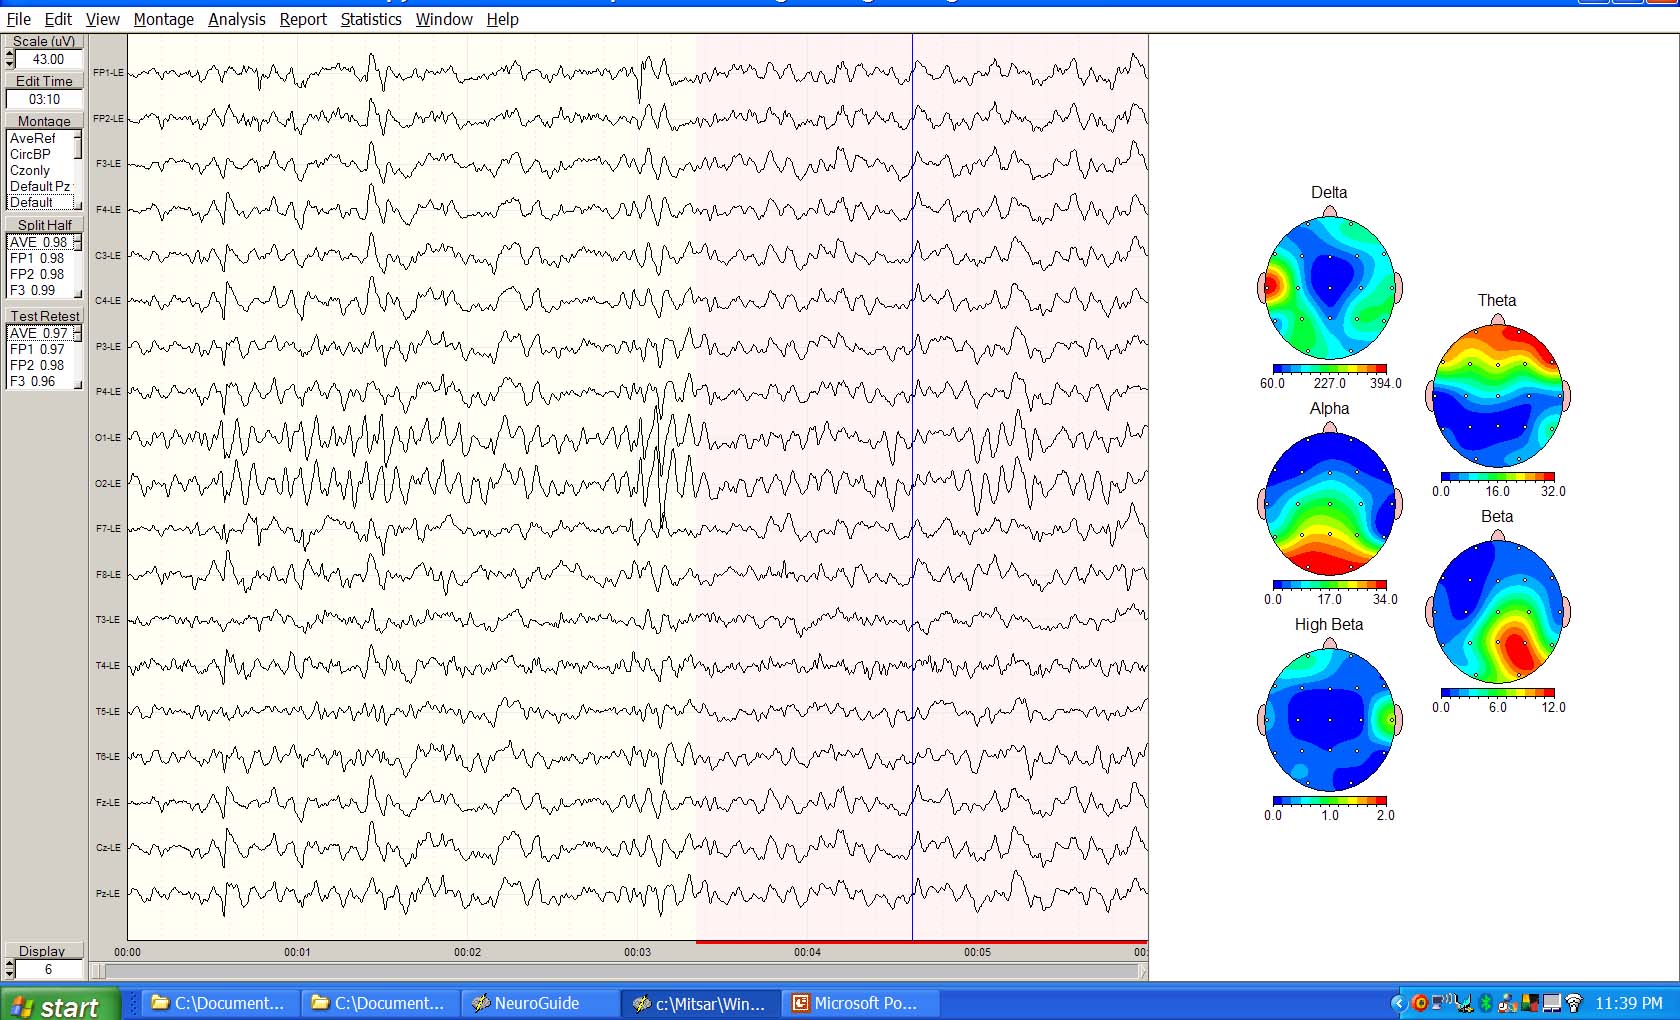
Image: Quantitative EEG analysis software (Neuroguide) is used to edit the EEG data.
The software compares the EEG to a database of normal brain function. This produces maps and tables that show which areas of the brain are over or under active compared to normal. The brain maps can also show if there are problems with the connections between regions of the brain.
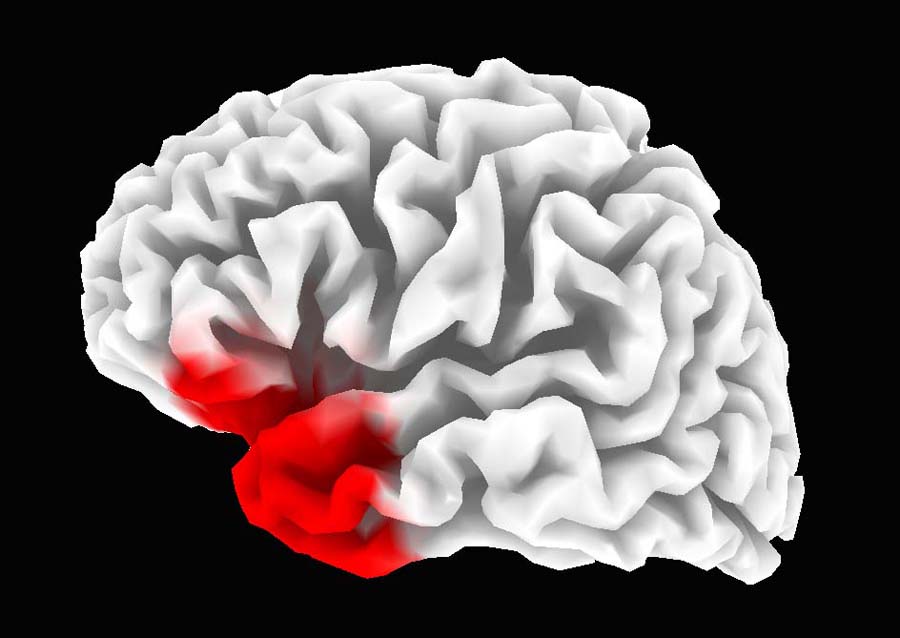
Image: 3D analysis of EEG frequency location (LORETA)
The LORETA analysis can take the information from the electrodes on the scalp and essentially triangulate where within the skull specfic EEG frequencies are being generated. This can help determine what type of disorder and how to treat it.
EEG Neurofeedback
Image: Thermometers graphic for EEG biofeedback
EEG neurofeedback is biofeedback of electrical activity in the brain. Software is used to isolate and target specific frequencies in the brain. The software provides feedback when the brainwaves change in the way we desire (more healthy amounts). Each of the thermometers represent the amount of brain electrical activity in certain frequencies. The numbers are the thresholds or goal lines for each frequency. The positive or negative symbol represents whether the amount of activity in the frequency band should increase or decrease.
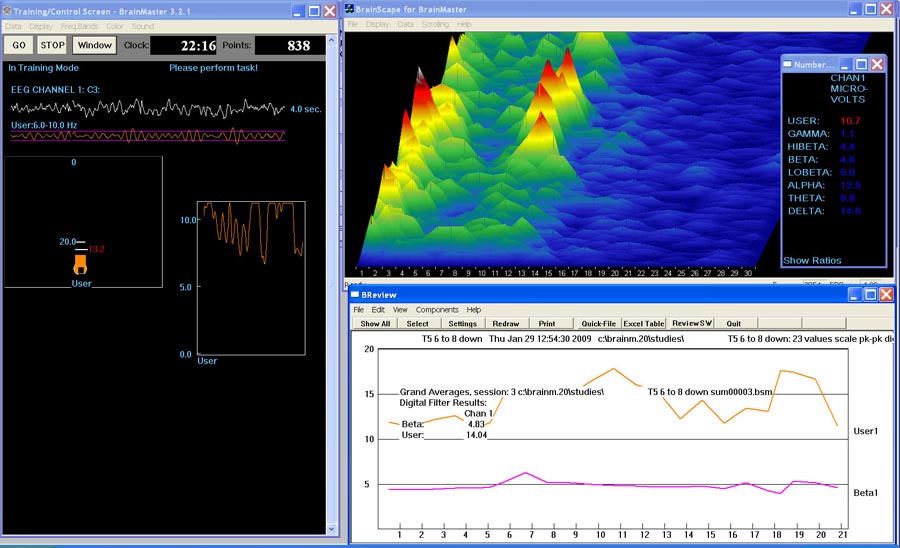
Image: EEG biofeedback software
This is an example of the screens used by Dr. Zukiwski during EEG neurofeedback. The box on the left shows the raw EEG from one electrode site on the head, the training threshold (goal line), and the percentage of time above or below that goal line. The upper right hand box is a scrolling display of all of the EEG frequences over time. This is useful for showing bursts of EEG activity. The lower right hand box is showing the progress of the training session.